
New Open Directories features, a more flexible Advanced Search, and better ways to track how infrastructure changes over time.
Over the past month, we’ve shipped a batch of updates to Validin: new Open Directories features, a more flexible Advanced Search, and better ways to track how internet-facing infrastructure changes over time.
You can now investigate exposed files directly from domain and IP detail pages, build more complex queries across multiple data sources, and see at a glance how services and web content change.
More Ways to Work with Open Directories
Since launching Open Directories, we’ve added more ways to search, investigate, and retrieve exposed files.
Open Directories on Detail Pages
Open Directories captures now show up directly on domain and IP detail pages, alongside DNS records, host responses, TLS certificates, and other historical data.
If a domain or IP you’re already looking at is hosting exposed files, you’ll see them right there. You don’t need to run a separate Open Directories search.
You can also download captured directories as ZIP or TAR.GZ archives, with optional password protection on ZIP downloads. Use this to pull suspicious files, exposed tooling, or staged payloads for offline analysis.
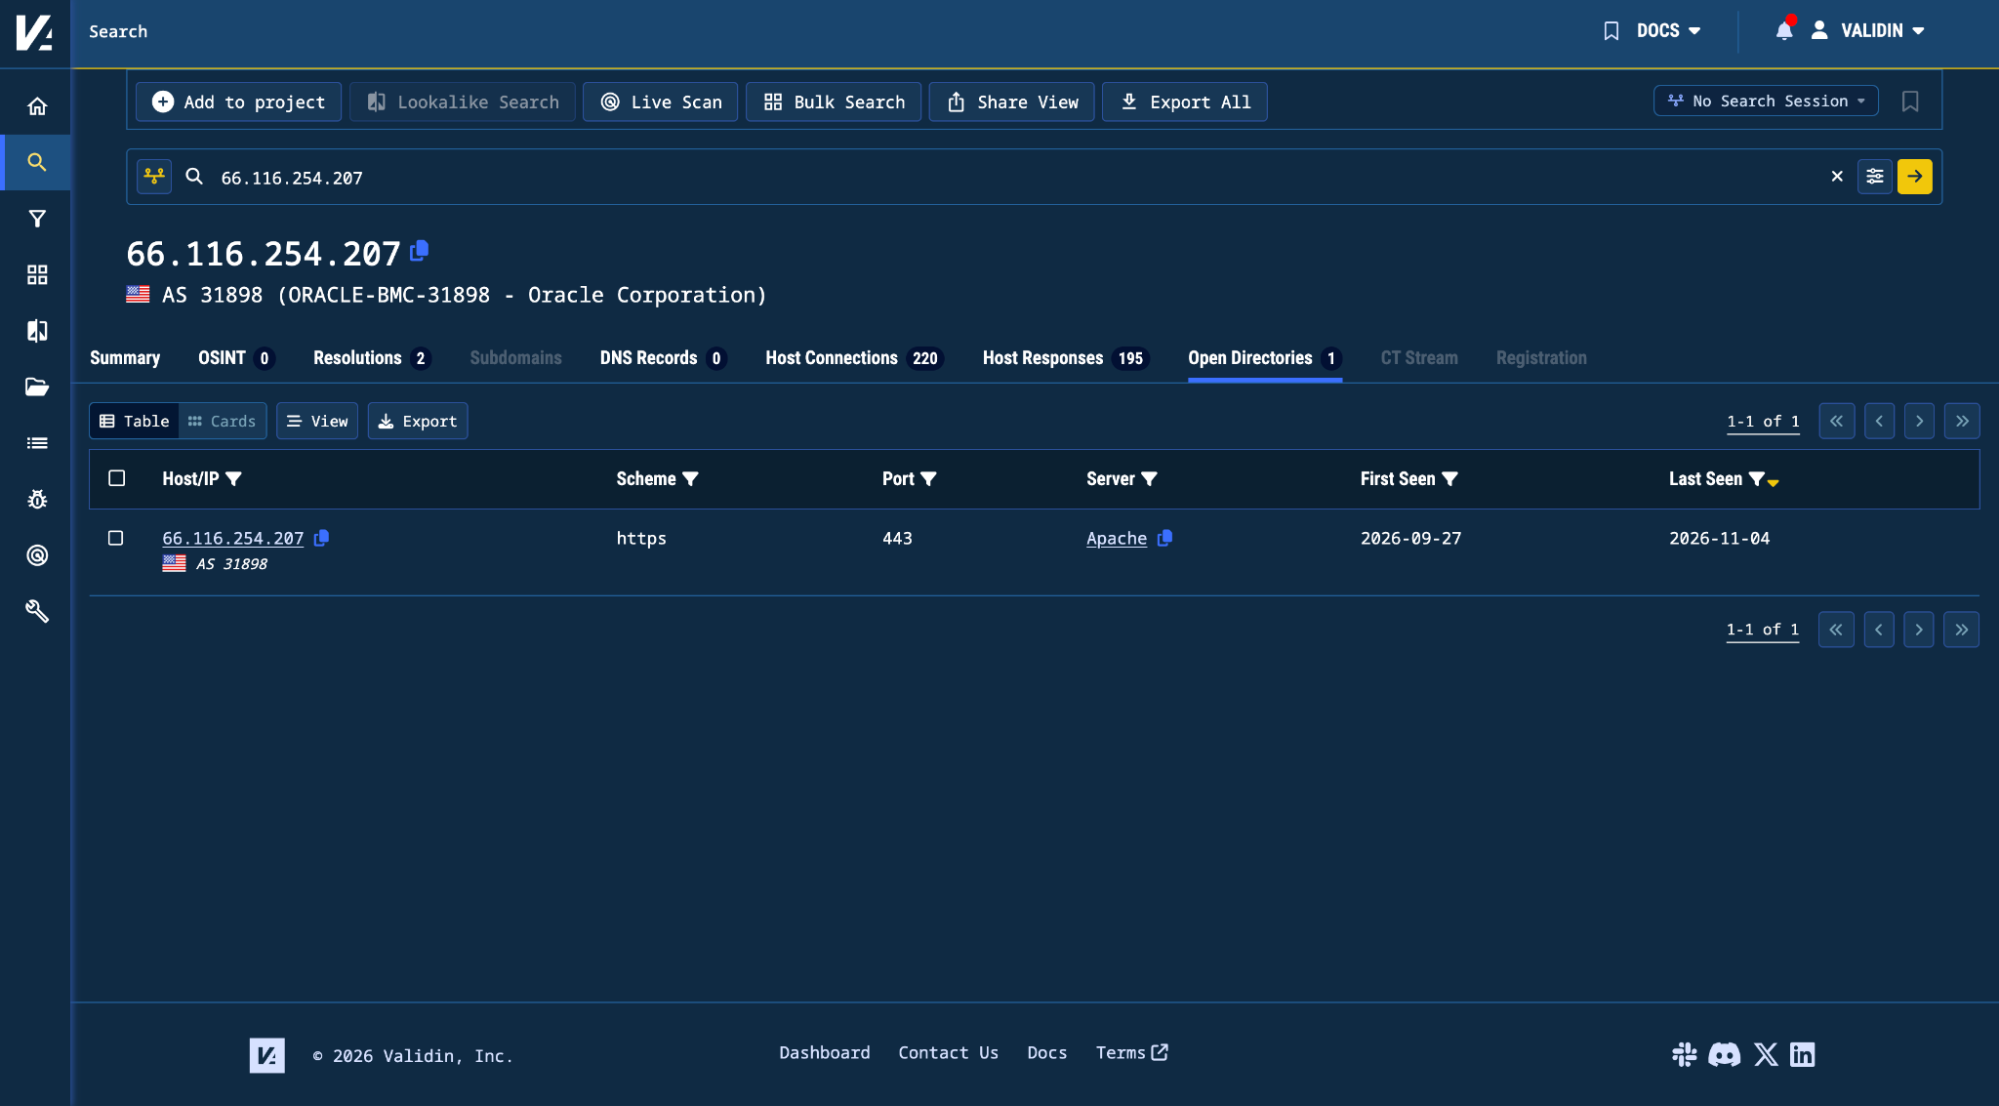
Figure 1. IP detail page showing the new Open Directories tab.
File-Level Search Results
Open Directories search results now point you to the specific files behind a match.
Previously, searches returned the parent directory containing matching files. Now you’ll see the individual files that matched, along with the search conditions each one satisfied.
This shows exactly why a result came back, which helps most when you search on several file attributes at once. You no longer need to dig through entire directories to find the files that matter.
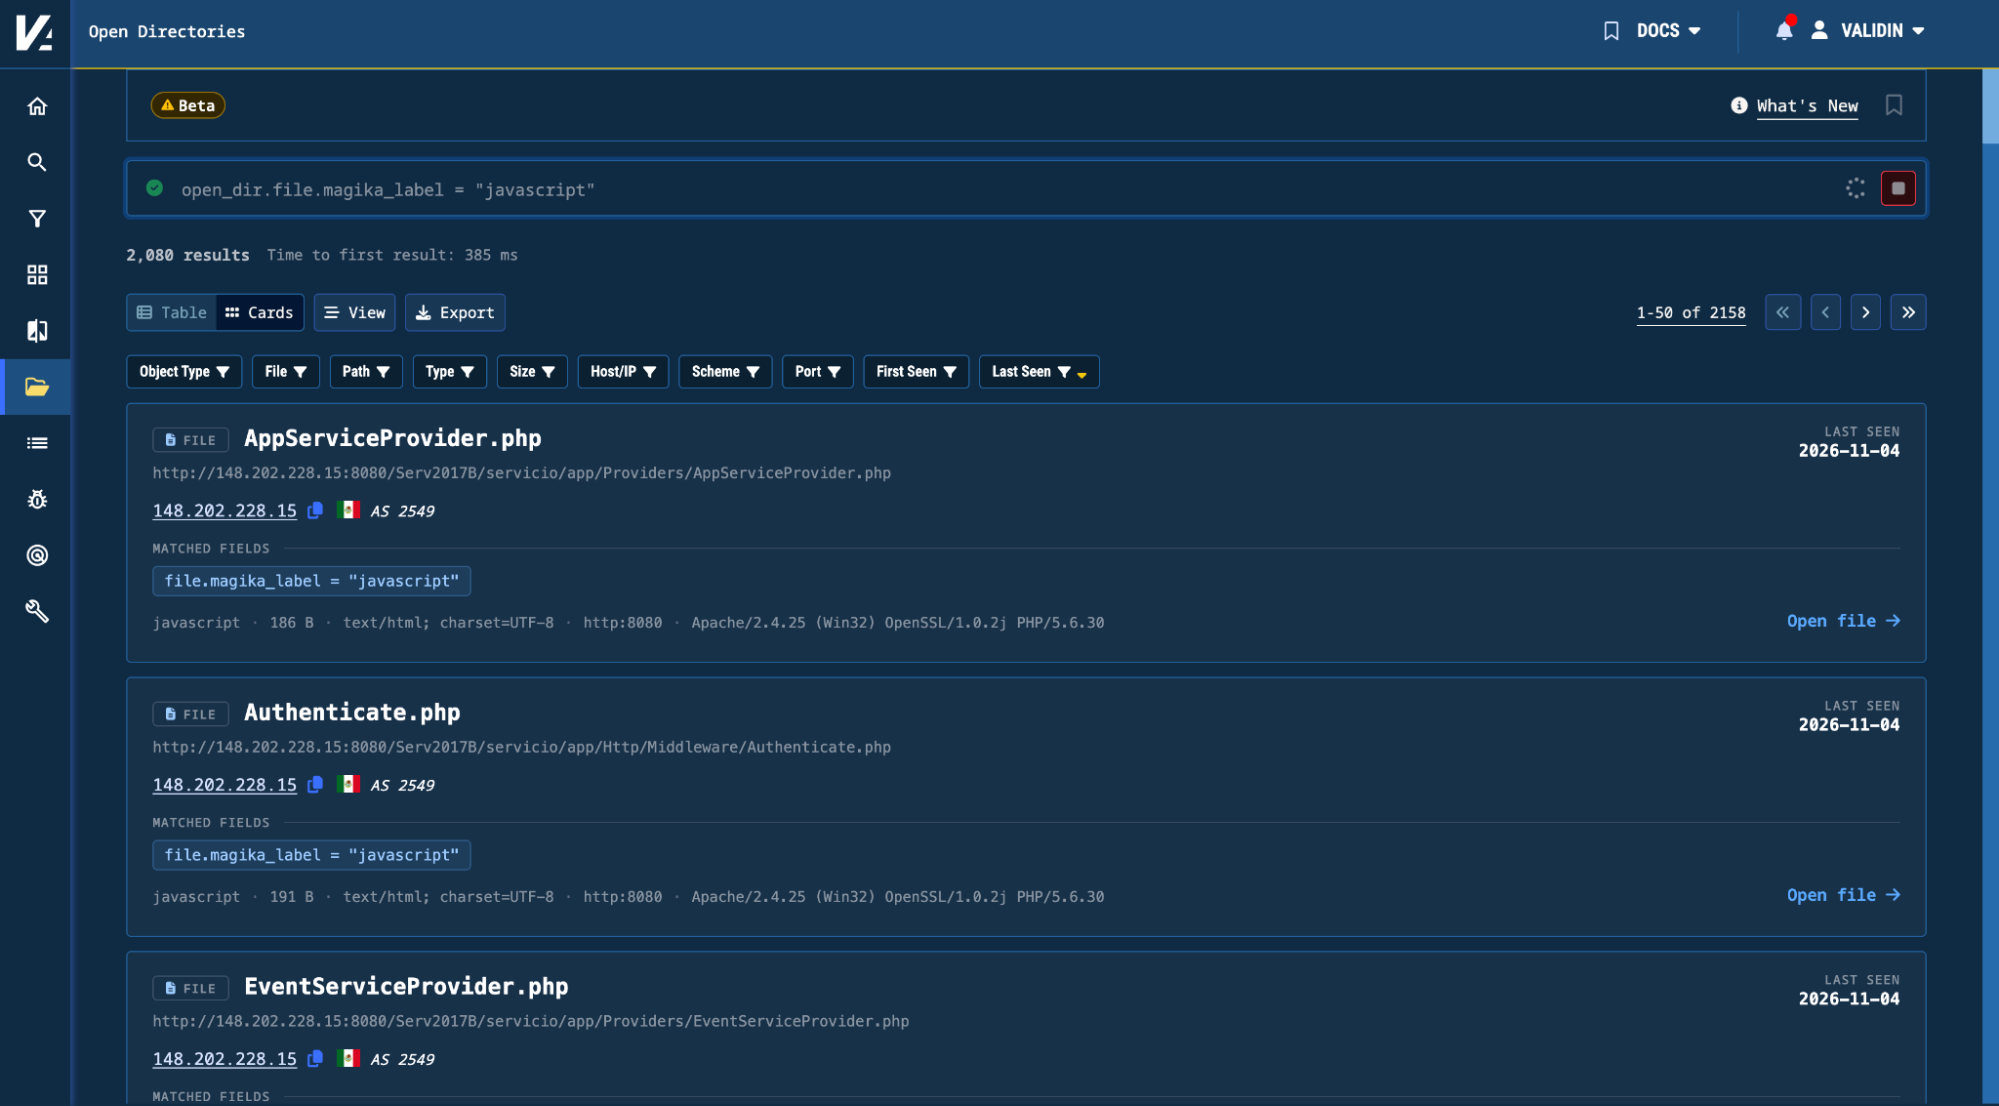
Figure 2. Open Directories search results showing individual matching files and matched conditions.
Open Directories API (Beta)
We’re also releasing an Open Directories API in beta, so you can bring this data into your threat hunting, enrichment, and investigation workflows.
With the API, you can search Open Directories data, pull captures for domains, IP addresses, CIDR ranges, and URLs, and look up files by their cryptographic hashes.
For example, if you’re investigating a suspicious file hash, you can search for other copies of that file in exposed directories, see which infrastructure is hosting them, and download the files for a closer look.
More Flexible Advanced Search
Advanced Search now supports the OR operator, so you can combine alternative conditions in one query instead of running separate searches.
You can also use more attribute combinations from host responses, DNS records, and domain registration data when combining conditions across sources.
For example, you can search for domains that share a particular HTTP page title, DNS nameserver, and registrar in one query. You no longer need to run three searches and cross-reference the results by hand.
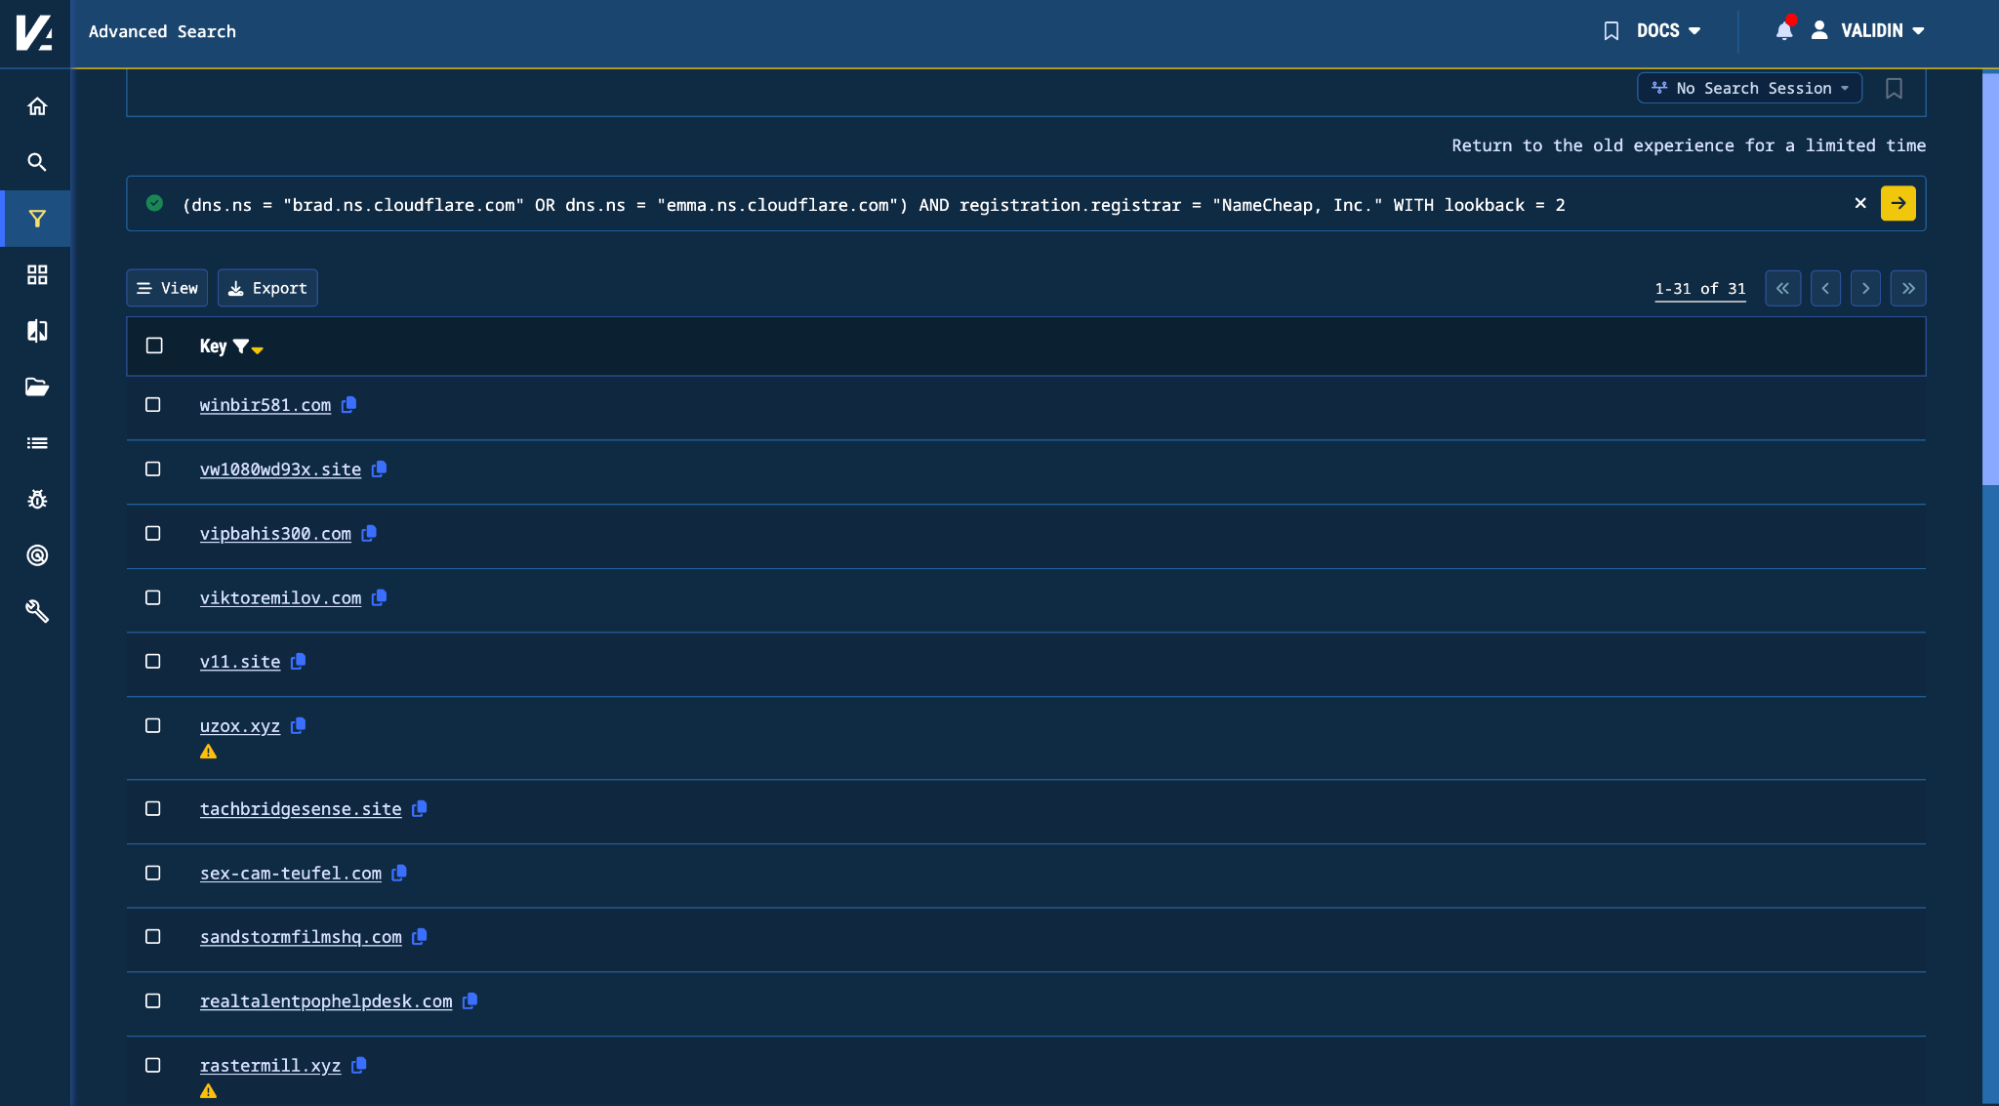
Figure 3. Advanced Search using OR operators and conditions across DNS and registration data.
Host Response History and Table Views
We’ve made a few changes to domain and IP detail pages to help you track how services change over time and move through large sets of historical data faster.
Host Responses Timeline
The Host Responses section now has a timeline view showing observed ports and services over time.
Each service gets its own row, so you can see when a service first appeared, when it changed, and when it disappeared.
This is especially useful for infrastructure that changes often, such as hosts that rotate through different services or briefly open extra ports.
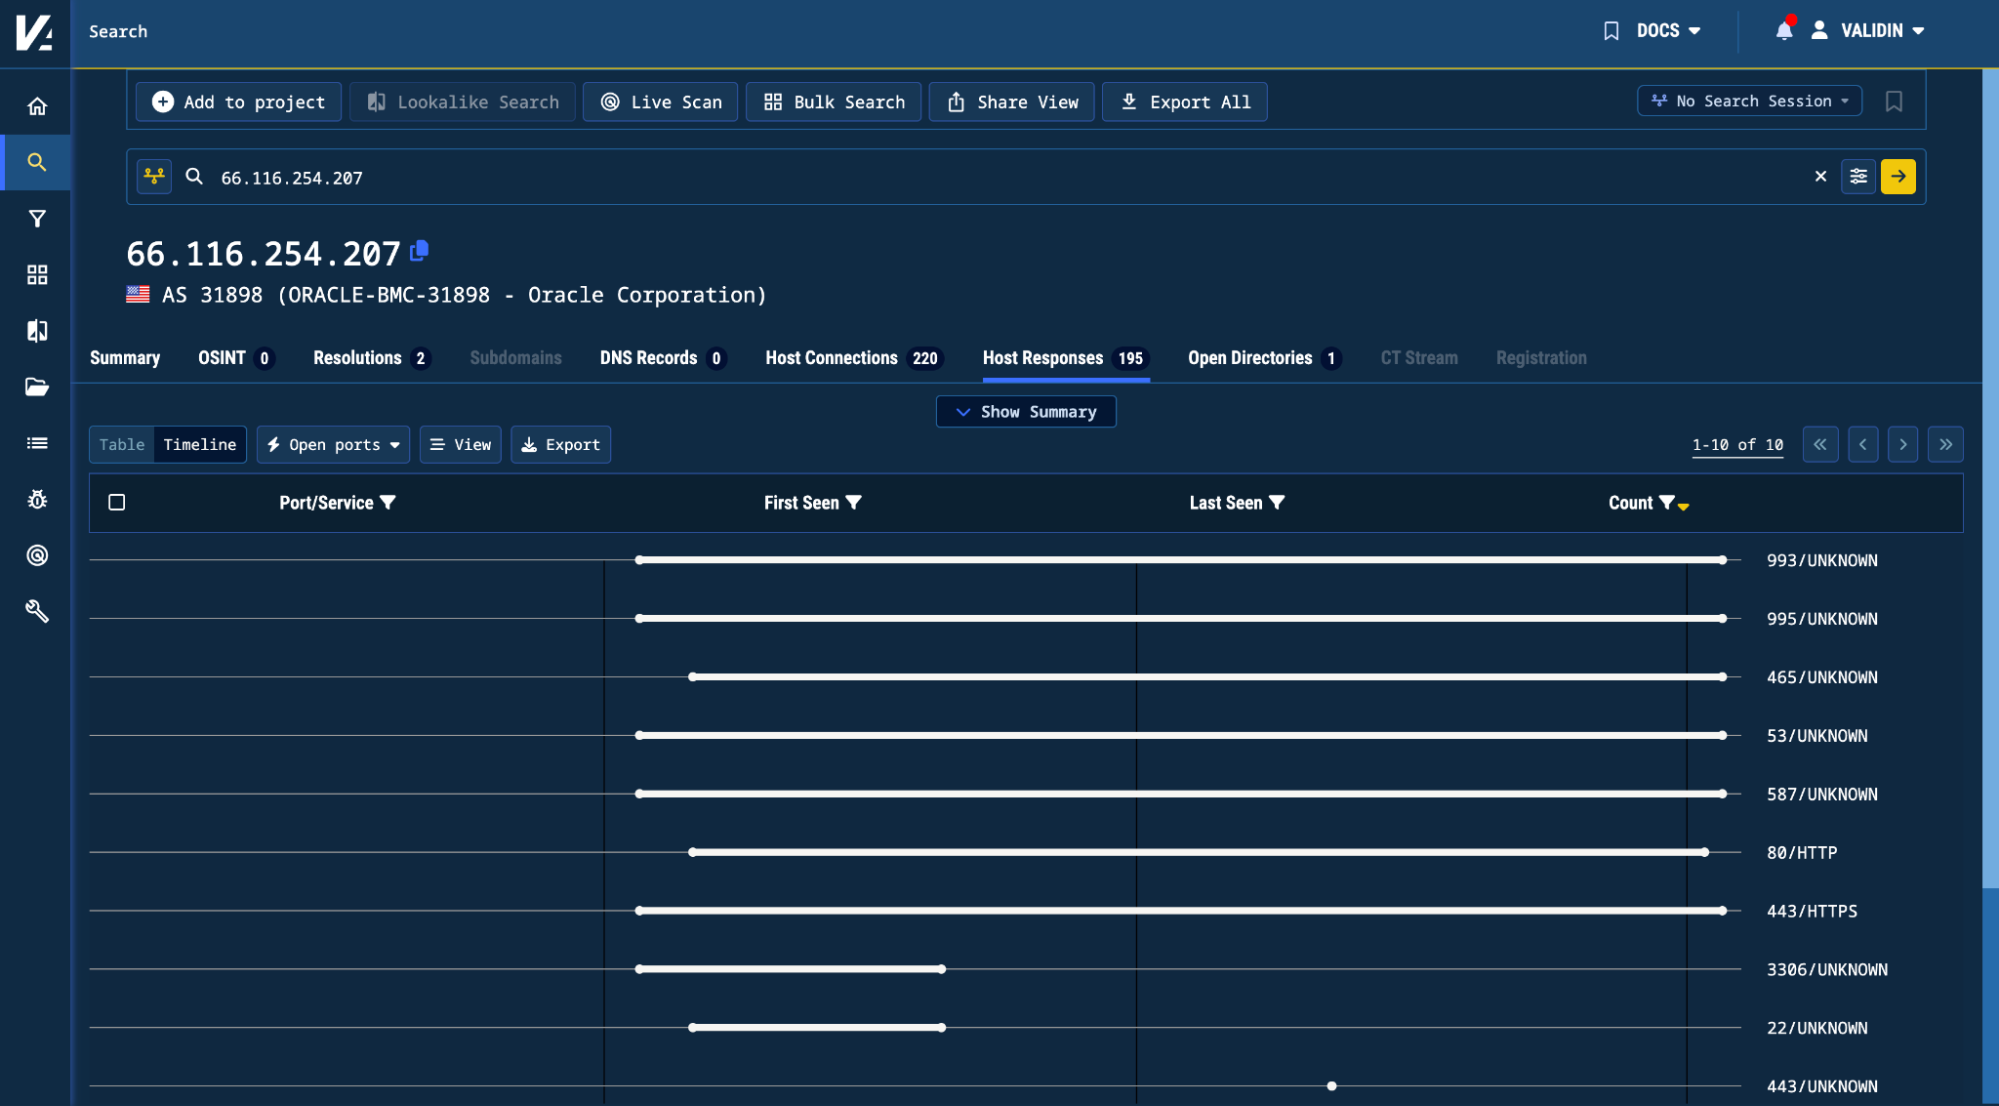
Figure 4. Host Responses timeline showing historical activity across multiple ports and services.
Table Column Presets
Tables on domain and IP detail pages now have one-click column presets, so you can switch views without picking columns by hand every time.
Each preset fits a different kind of investigation. If you’re tracking content changes, pick the view focused on response hashes and related metadata. If you want the full history of a host, switch to the view that shows everything.
Presets work well with the new timeline. Use the timeline to find when something changed, then open the table to see exactly what changed.
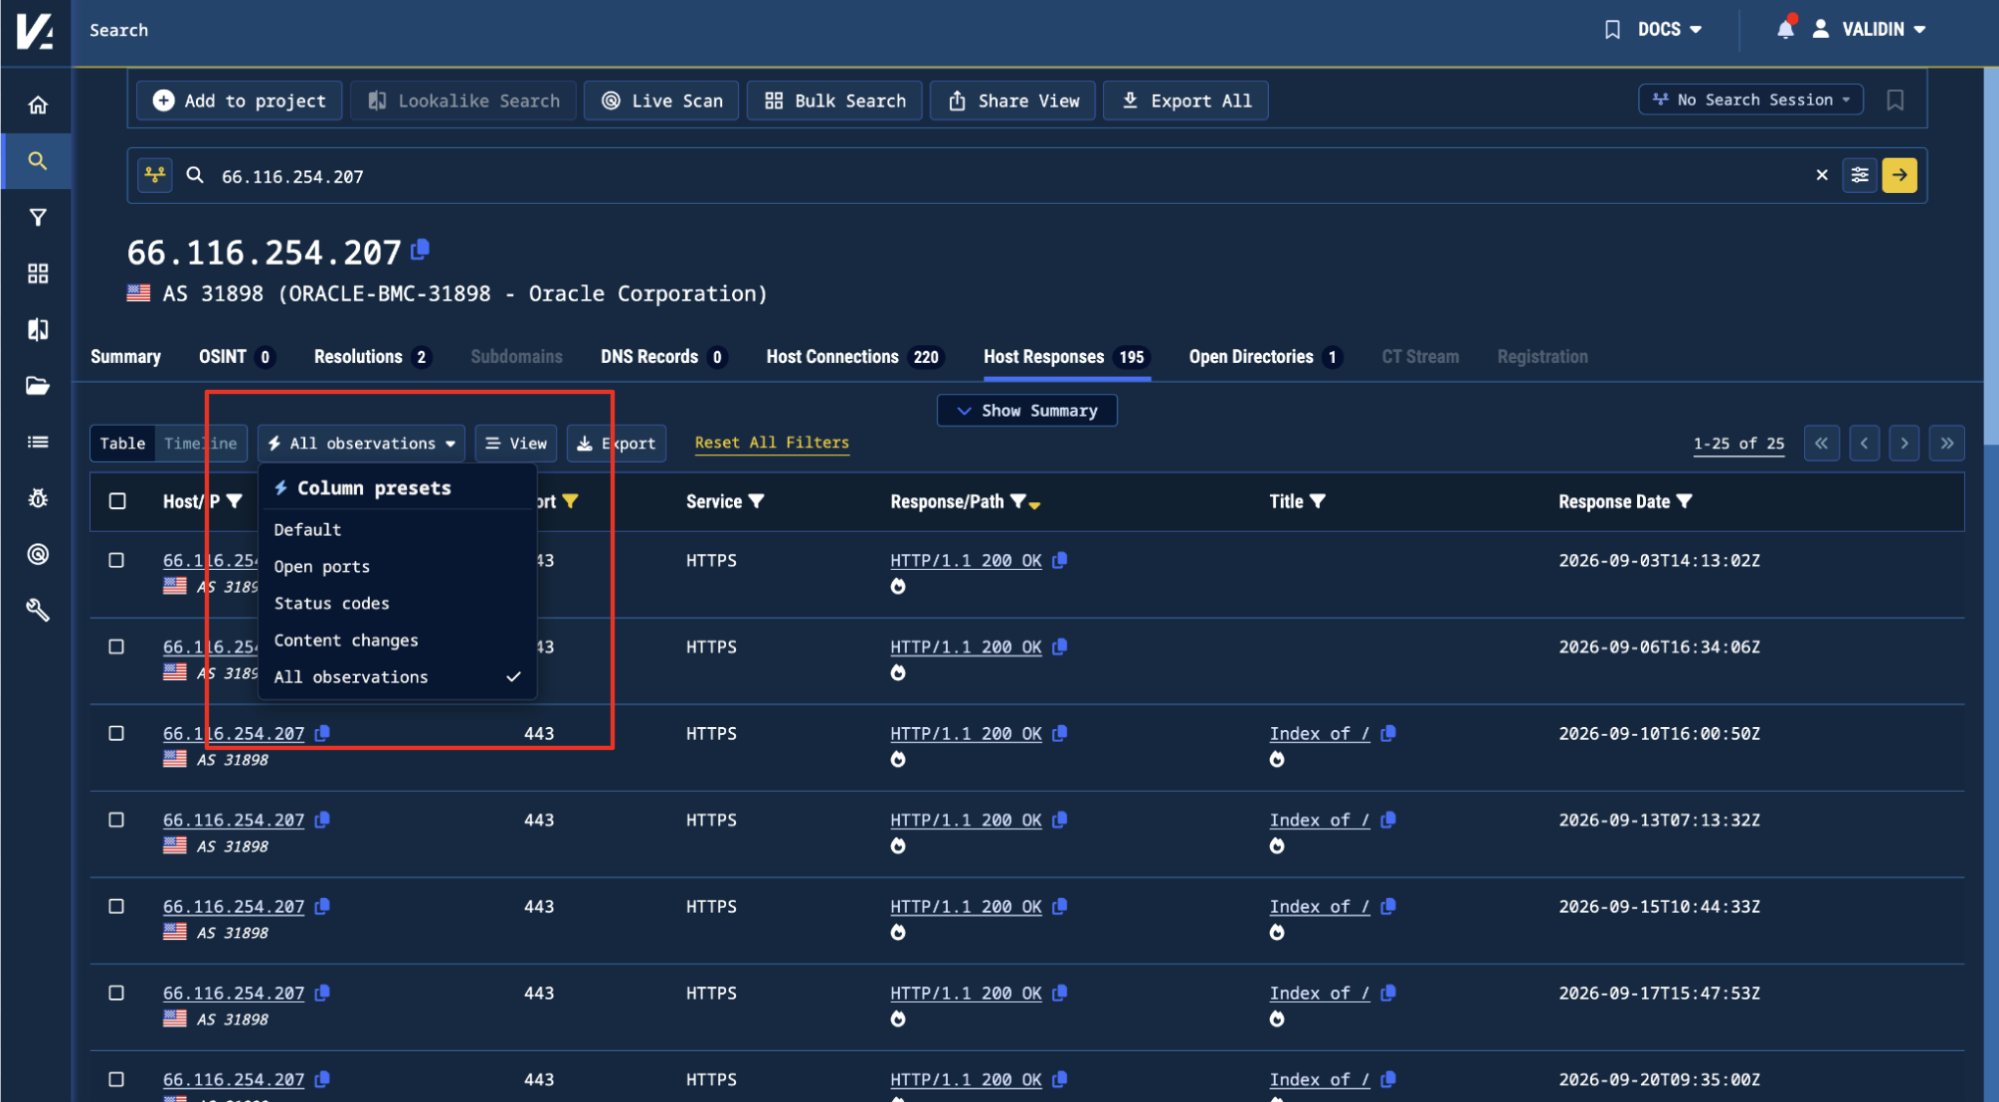
Figure 5. Host Responses table showing available column presets and the Body Hash column.
What’s Next
We’re still expanding what Validin collects and how you can search and investigate it. Our goal is to make historical infrastructure data more useful in your day-to-day work.
To learn more, check out our documentation or reach out at lets.talk@validin.com.